

RV Rental Market Intelligence
Stop Leaving Money on the Table
The average RV owner underprices by 18% on peak weekends. RVIntel tracks supply, demand, and competitor rates across 7 US regions — from San Diego to Seattle — so you never guess again.
No credit card required · From $9.99/mo after trial · Cancel anytime
Coast-to-Coast Market Intelligence
Live pricing data across California, the Mountain West, Southwest, Southeast, Midwest, Northeast, and Pacific Northwest.
Market Intelligence That Pays for Itself
Stop guessing. Start earning what your RV is actually worth.
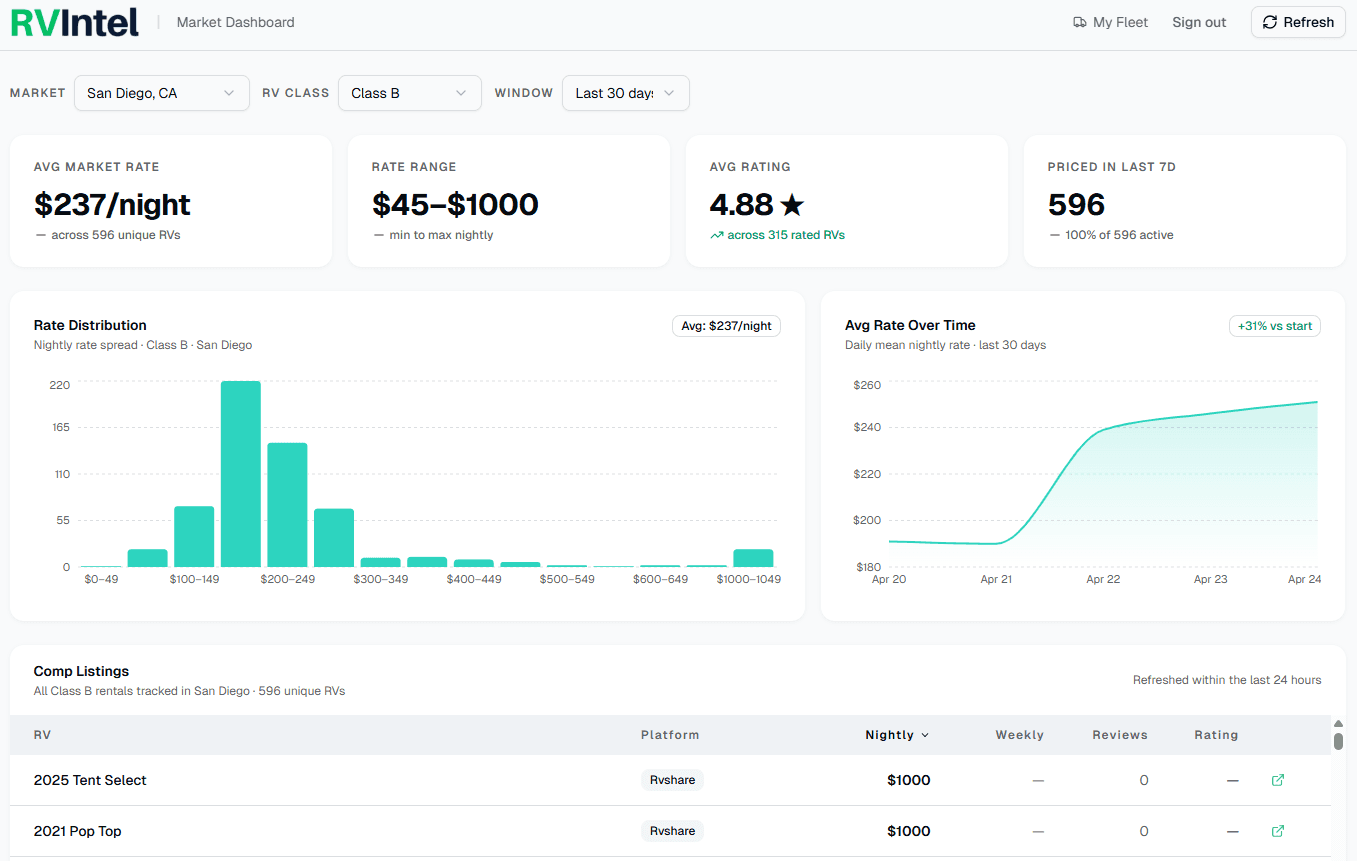
Market Comps
See exactly what comparable RVs are charging in your market. Filter by class, make, and amenities to find your true competitors.
Occupancy Signals
Track blocked calendars and booking velocity across your local market to understand real demand before you price.
Event Alerts
Get notified when high-demand events hit your area so you can raise rates at exactly the right moment.
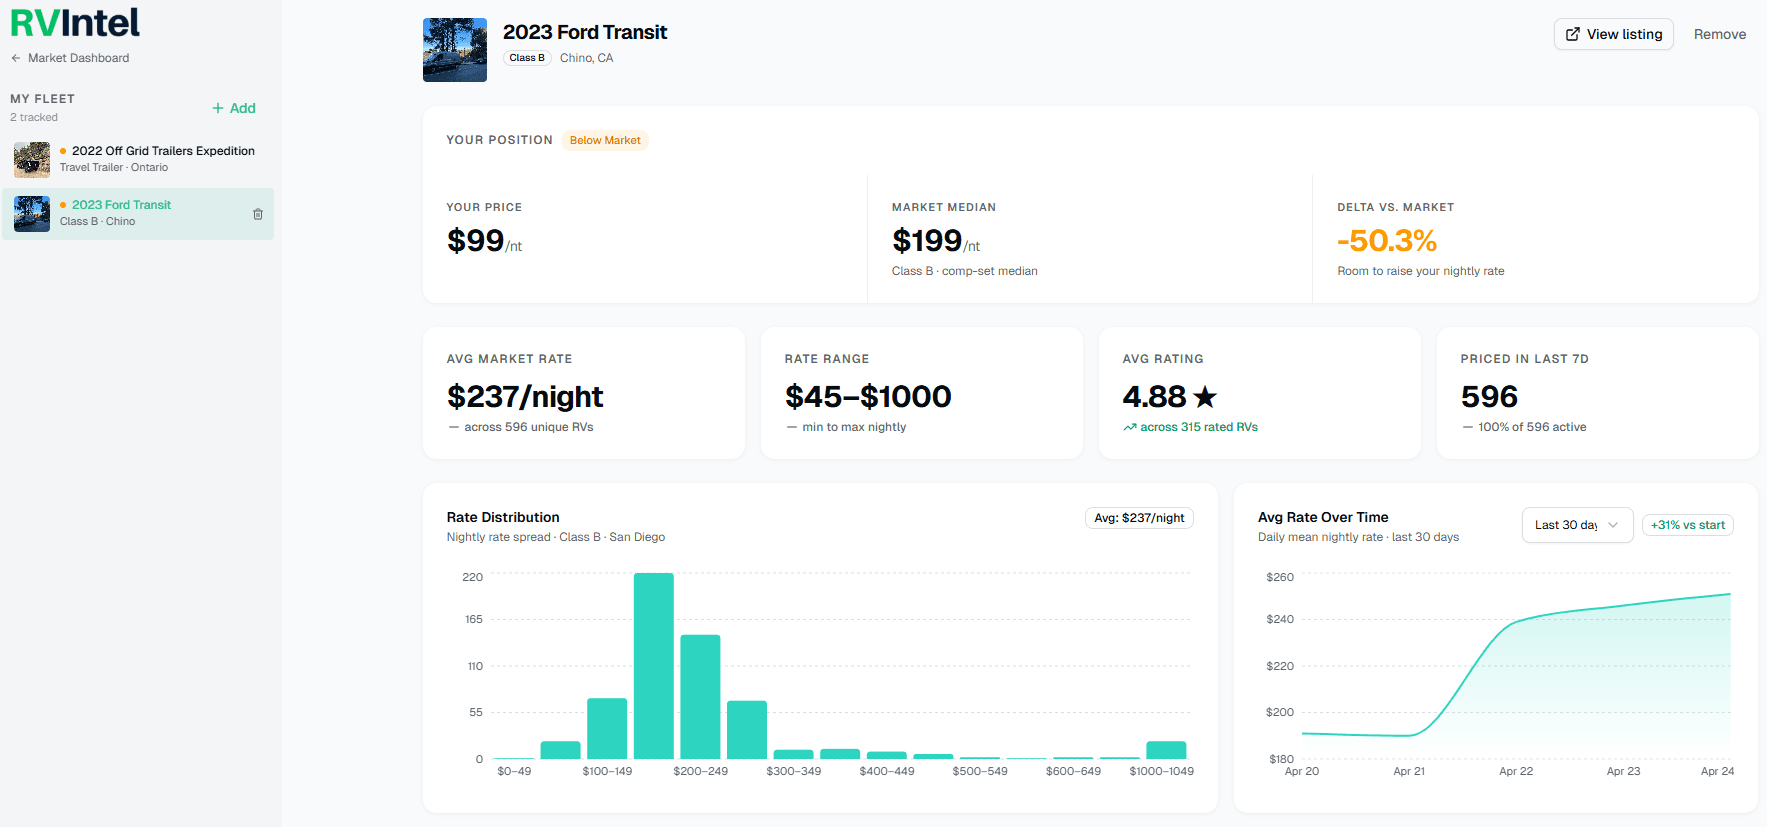
See Where Every RV Stands in Its Market
Track each vehicle in your fleet against its local comp set. Know instantly if you are priced below market — and how much headroom you have to raise rates.
Ready to Maximize Your RV Revenue?
Live data across 33 markets. Start your free trial and price with confidence.
No credit card required · From $9.99/mo after trial · Cancel anytime